


A project management dashboard turns a scattered SharePoint project site into a single screen where tasks, progress, and deadlines all live together. This guide walks through what a PM dashboard should contain, how to build one from a SharePoint project site step by step using web parts, and how apps like Virto Kanban, Virto Charts & Data Visualization, and Virto Calendar add the board, reporting, and calendar views SharePoint lacks out of the box — plus how to surface the dashboard in Microsoft Teams.
Quick Answer
You build a SharePoint project management dashboard from a project site: store your tasks and project data in SharePoint lists, then surface them on one page using web parts — a task board (Kanban), charts, and a calendar. Native web parts cover the basics; apps such as Virto Kanban, the free Virto Charts & Data Visualization App, and Virto Calendar add the visual board, reporting, and calendar views that SharePoint doesn’t provide natively.
What Is a SharePoint Project Management Dashboard — and What to Include
A project management dashboard is a single page that pulls together the most important signals about a project so a manager or team can see status at a glance, without clicking through separate lists, libraries, and sites. In SharePoint, that page lives on your project site and is assembled from web parts, each connected to the underlying data.
A well-built dashboard usually surfaces the following building blocks:
- Task board (Kanban): tasks grouped by status (To Do / In Progress / Done) so the team can see workload and flow at a glance.
- Charts and metrics: tasks by status, tasks by assignee, completion and burndown, and workload distribution — the numbers that tell you whether the project is on track.
- Calendar: deadlines, meetings, and milestones in a monthly or weekly view.
- Document access: a link to, or view of, the project’s document library so files are one click away.
- Key links and quick actions: shortcuts to add a task, open the project plan, or jump to related sites.
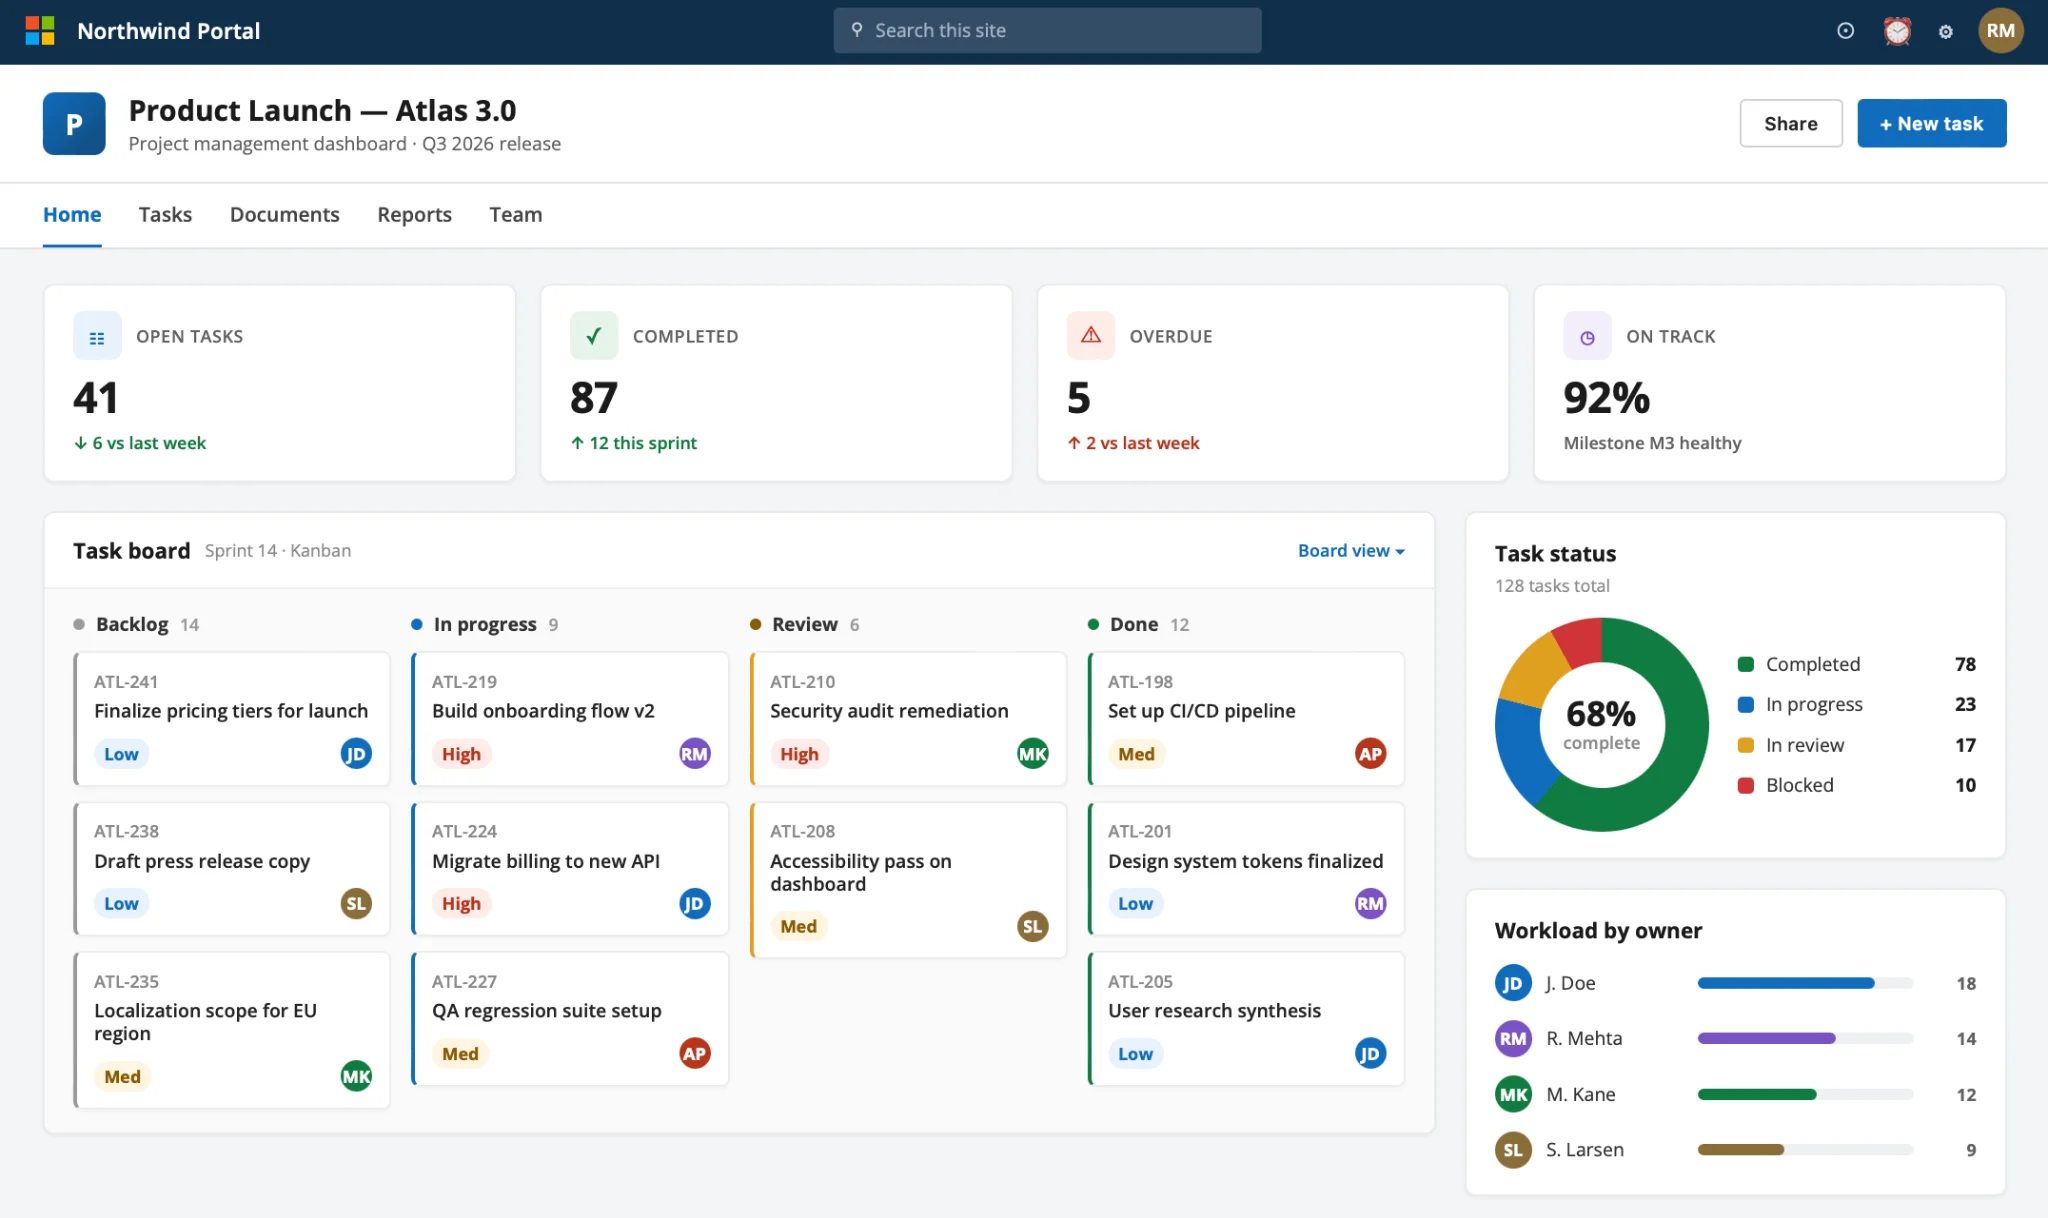
Pic. 1. Example layout of a SharePoint project management dashboard combining a task board, charts, and stats on one page.
How to Build a Project Management Dashboard in SharePoint, Step by Step
Setting up a dashboard in SharePoint is a straightforward, repeatable process. The exact steps may vary slightly depending on your SharePoint version, but the sequence below applies to most modern SharePoint Online project sites.
Step 1: Create (or open) your project site
Start with a dedicated project site that will act as the home for all project data. If you don’t have one yet, create a new SharePoint site and choose a Team site, which comes with document libraries, lists, and page-building tools. Microsoft also offers a ready-made SharePoint project management site template that gives you a head start with pre-built components.
Step 2: Store your project data in lists
A dashboard is only as good as the data behind it. Create a SharePoint list to hold your tasks, with columns for status, assignee, priority, start date, due date, and any custom fields your project needs. Well-structured columns are what let your web parts filter, group, and chart the data later. Consider separate lists for tasks, milestones, and risks if your project is complex.
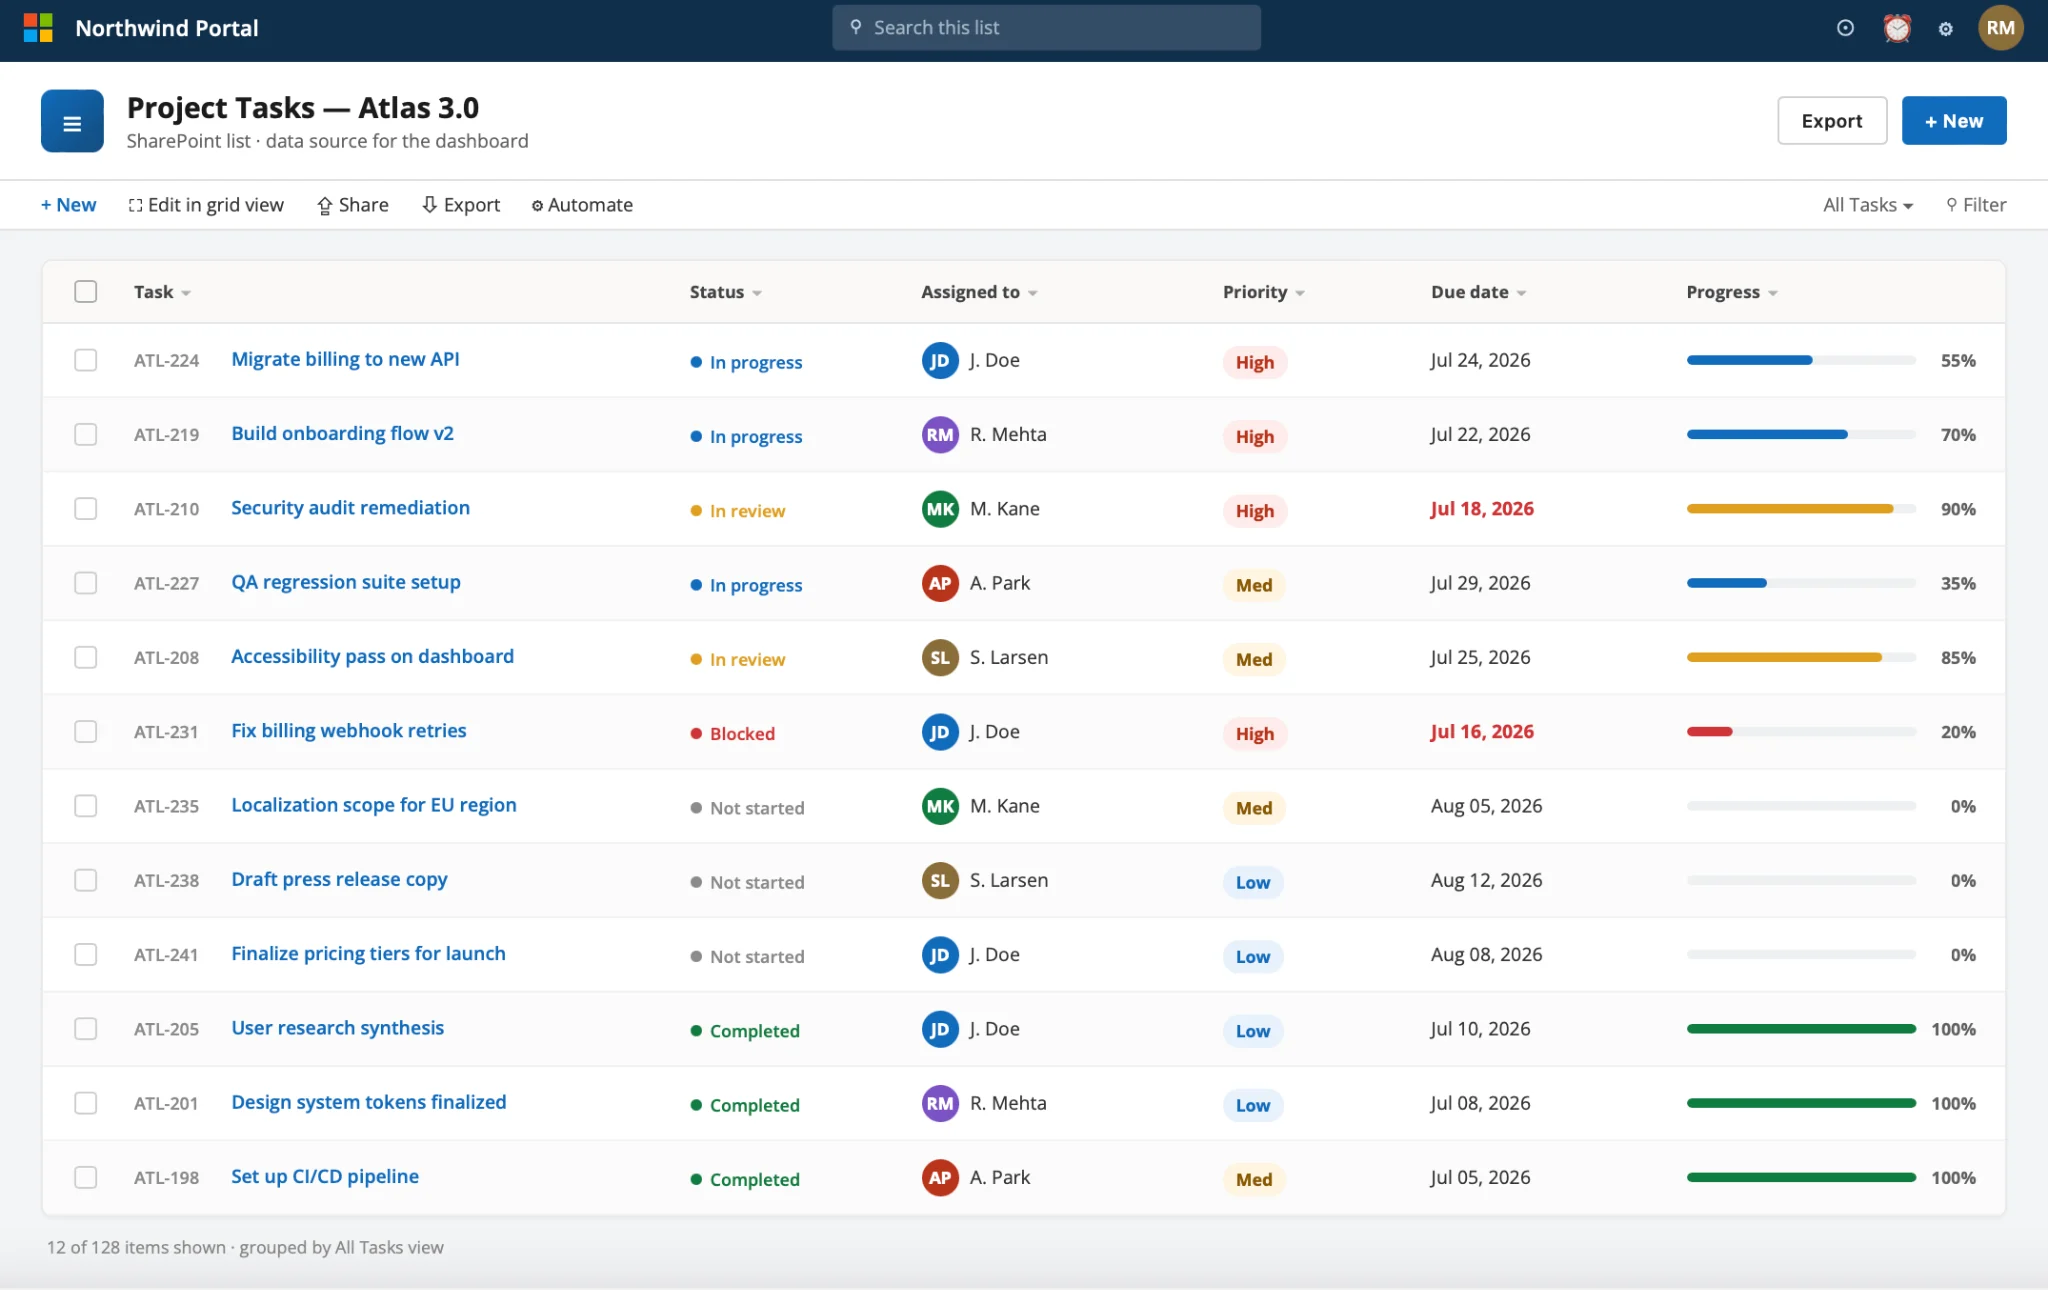
Pic. 2. A SharePoint task list with status, assignee, priority, and due-date columns — the data source for the dashboard.
Step 3: Create a dashboard page and add web parts
On your project site, create a new page and add the web parts that will make up the dashboard. Native SharePoint web parts you can start with include:
- List / List properties: embed your task list directly, or a filtered view of it.
- Quick Chart: display a simple bar or pie chart of task counts.
- Highlighted content: surface recent documents or items matching a query.
- Quick links: add shortcuts to the project plan, libraries, and related sites.
Arrange these in a multi-column section so several views sit side by side on one screen. Native web parts cover the essentials, but they don’t include a drag-and-drop Kanban board or rich project analytics such as burndown and workload charts — which is where the next step comes in.
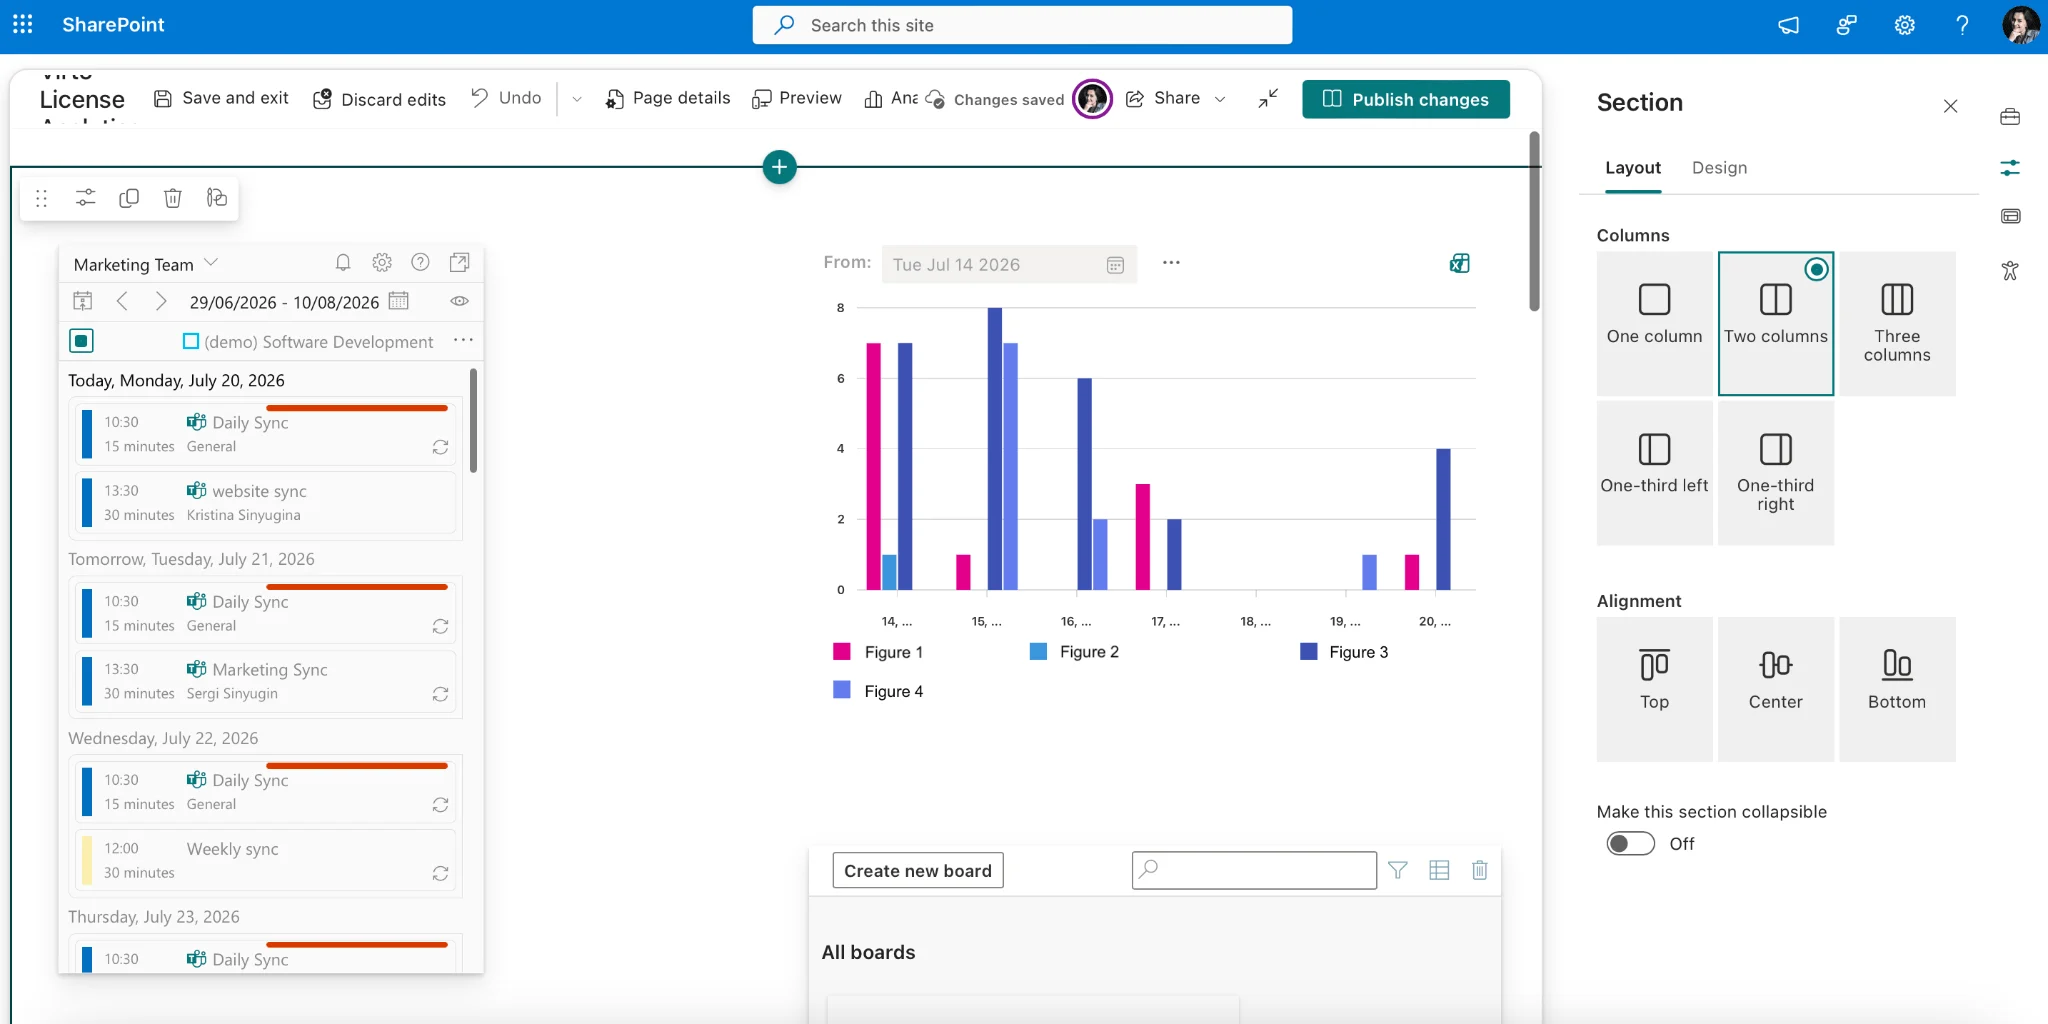
Pic. 3. Adding and arranging web parts on a SharePoint page to assemble the dashboard layout.
Step 4: Configure views and filters
Tune each web part so it shows the right slice of data: filter the task list to the current sprint, group by status, or sort by due date. Configure your charts to count tasks by status or assignee. The goal is a page where every element answers a specific question — what’s in progress, what’s overdue, who’s overloaded — without further clicks.
Building a Richer Dashboard with Virto Apps
Native SharePoint web parts give you a functional dashboard, but the views project managers rely on most — an interactive board and visual analytics — aren’t part of the built-in toolkit. VirtoSoftware apps add these, all within your Microsoft 365 environment and reading straight from your SharePoint lists.
Virto Kanban Board — the task board view
The Virto Kanban Board app turns any SharePoint task list into an interactive board with drag-and-drop cards, swimlanes, color-coded labels, subtasks, WIP limits, and built-in charts. Cards read and write back to your SharePoint list, so the board and the underlying data always stay in sync. Placed on your dashboard, it becomes the live task-flow view of the project. If you’re weighing which task view fits your project, our Gantt chart vs. Kanban board comparison breaks down when to use each.
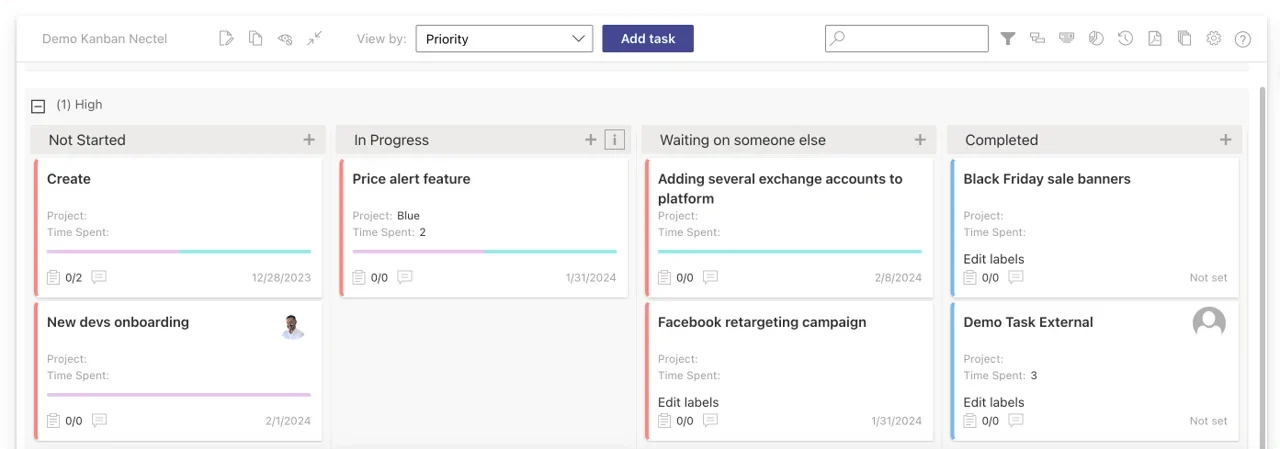
Pic. 4. Virto Kanban Board displaying SharePoint tasks as drag-and-drop cards with swimlanes and status columns.
Virto Charts & Data Visualization — the reporting view
The Virto Charts & Data Visualization app is a free tool that turns SharePoint list data into visual reports and dashboards inside Microsoft Teams and SharePoint. Build completion and burndown charts, track workload distribution and task-completion dynamics, and give stakeholders up-to-the-minute project insight — without exporting anything. It provides the analytics tiles of your dashboard, so status and progress are visible at a glance rather than buried in a list.
Virto Calendar and alerts — deadlines and updates
The Virto Calendar app overlays multiple calendars — task deadlines, meetings, and milestones — into one view you can embed on the dashboard, so time-based information sits alongside your board and charts. To keep the team informed of changes, the Virto Alerts and Reminders app can push email and Teams notifications when tasks or deadlines update.
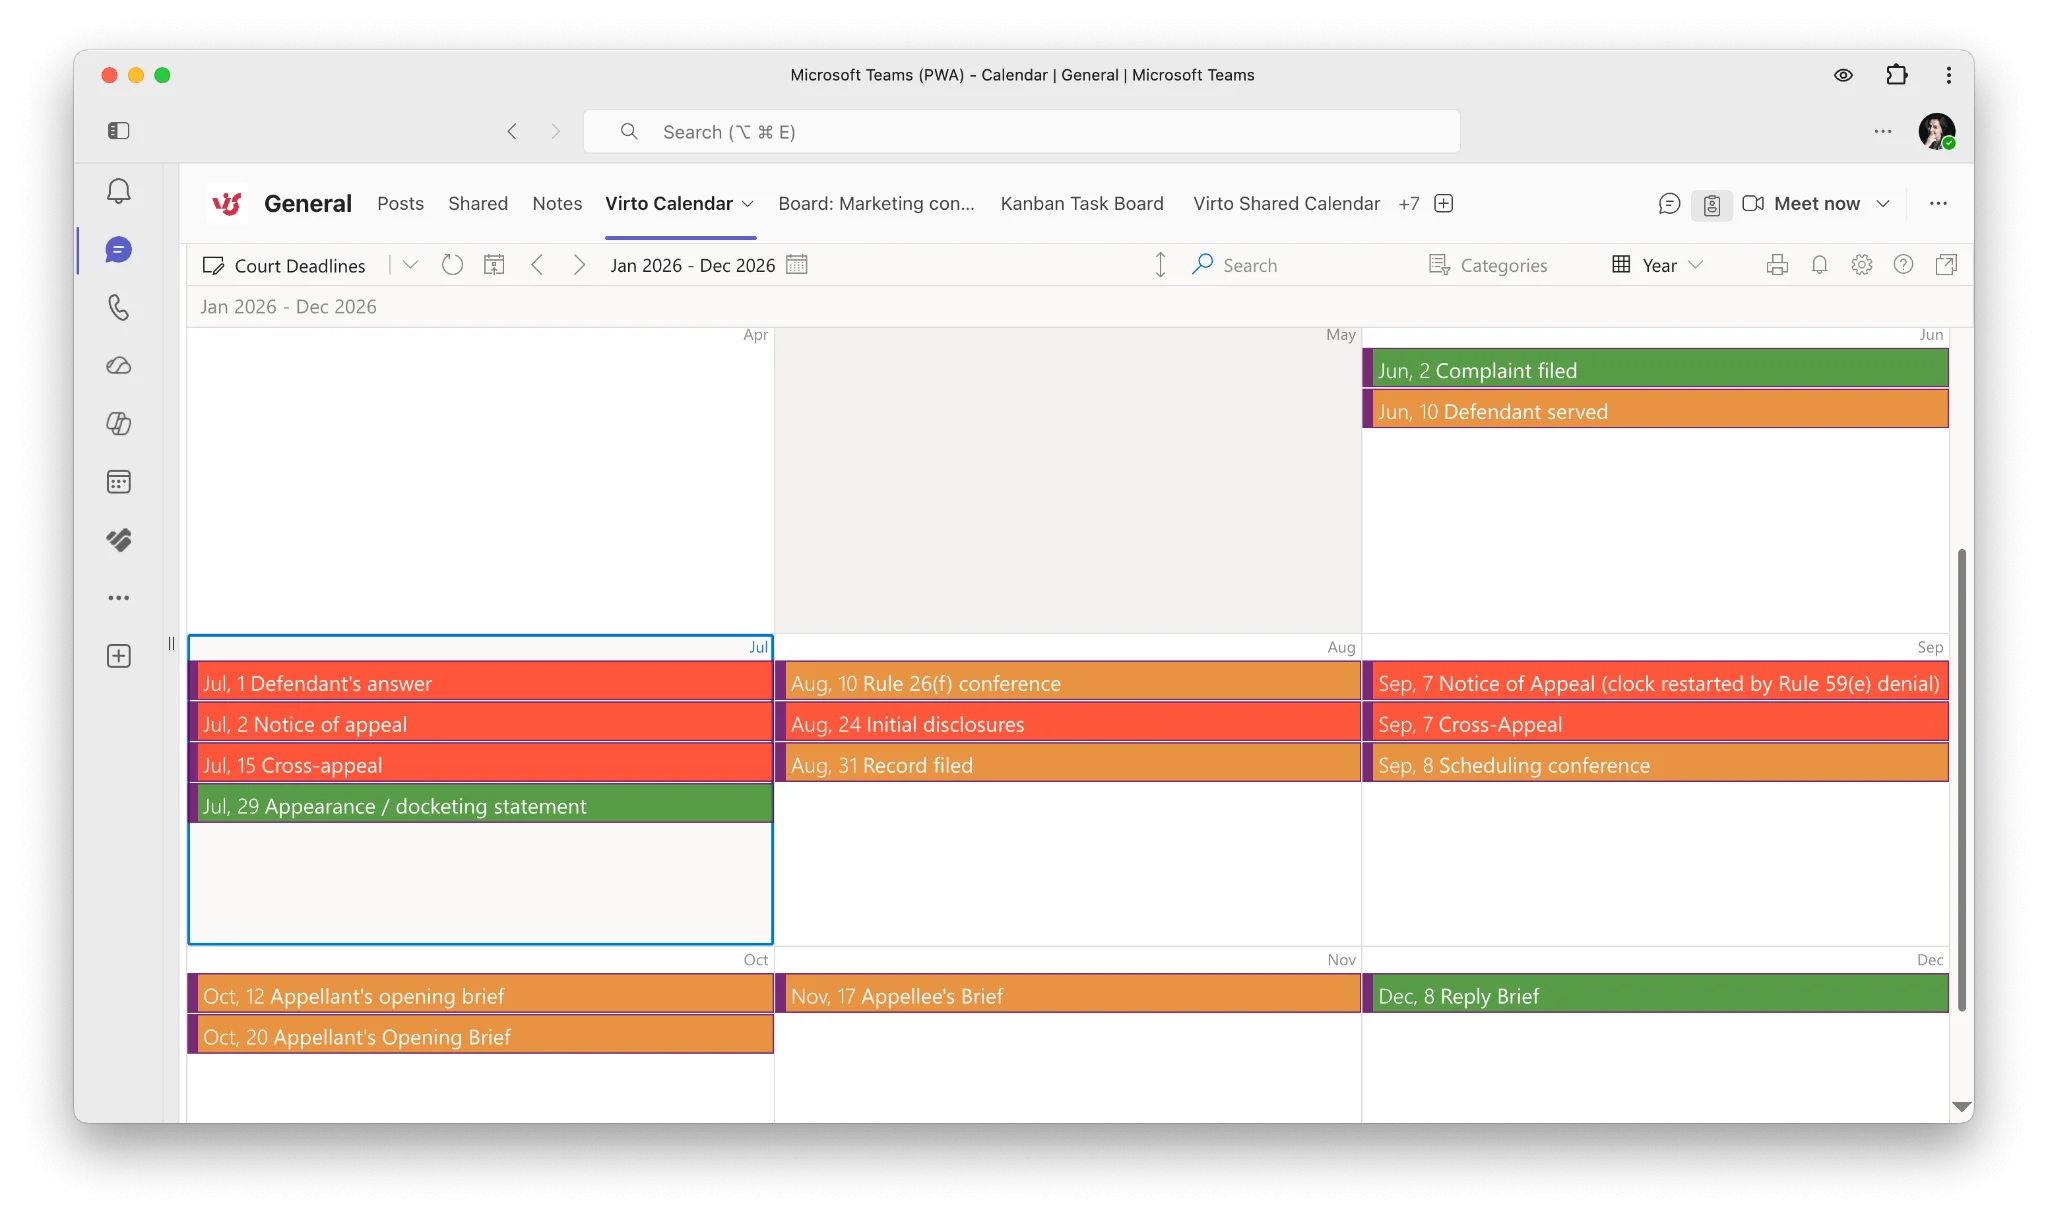
Pic. 5. Virto Calendar overlaying project deadlines and milestones in a monthly view.
Build your SharePoint dashboard faster
Add board, reporting, and calendar views to your project site in minutes.
▶ Try Virto Kanban Board free for 30 days
Show Your Project Dashboard in Microsoft Teams
Because the dashboard lives on a SharePoint page, you can surface it inside Microsoft Teams so the team sees it where they already work. Add the SharePoint page — or the individual Virto Kanban, Charts, and Calendar views — as a tab in the relevant Teams channel. This keeps a single source of truth: updates made in Teams flow back to the same SharePoint lists. For a deeper look at running projects in Teams, see our full guide to project management in Microsoft Teams.
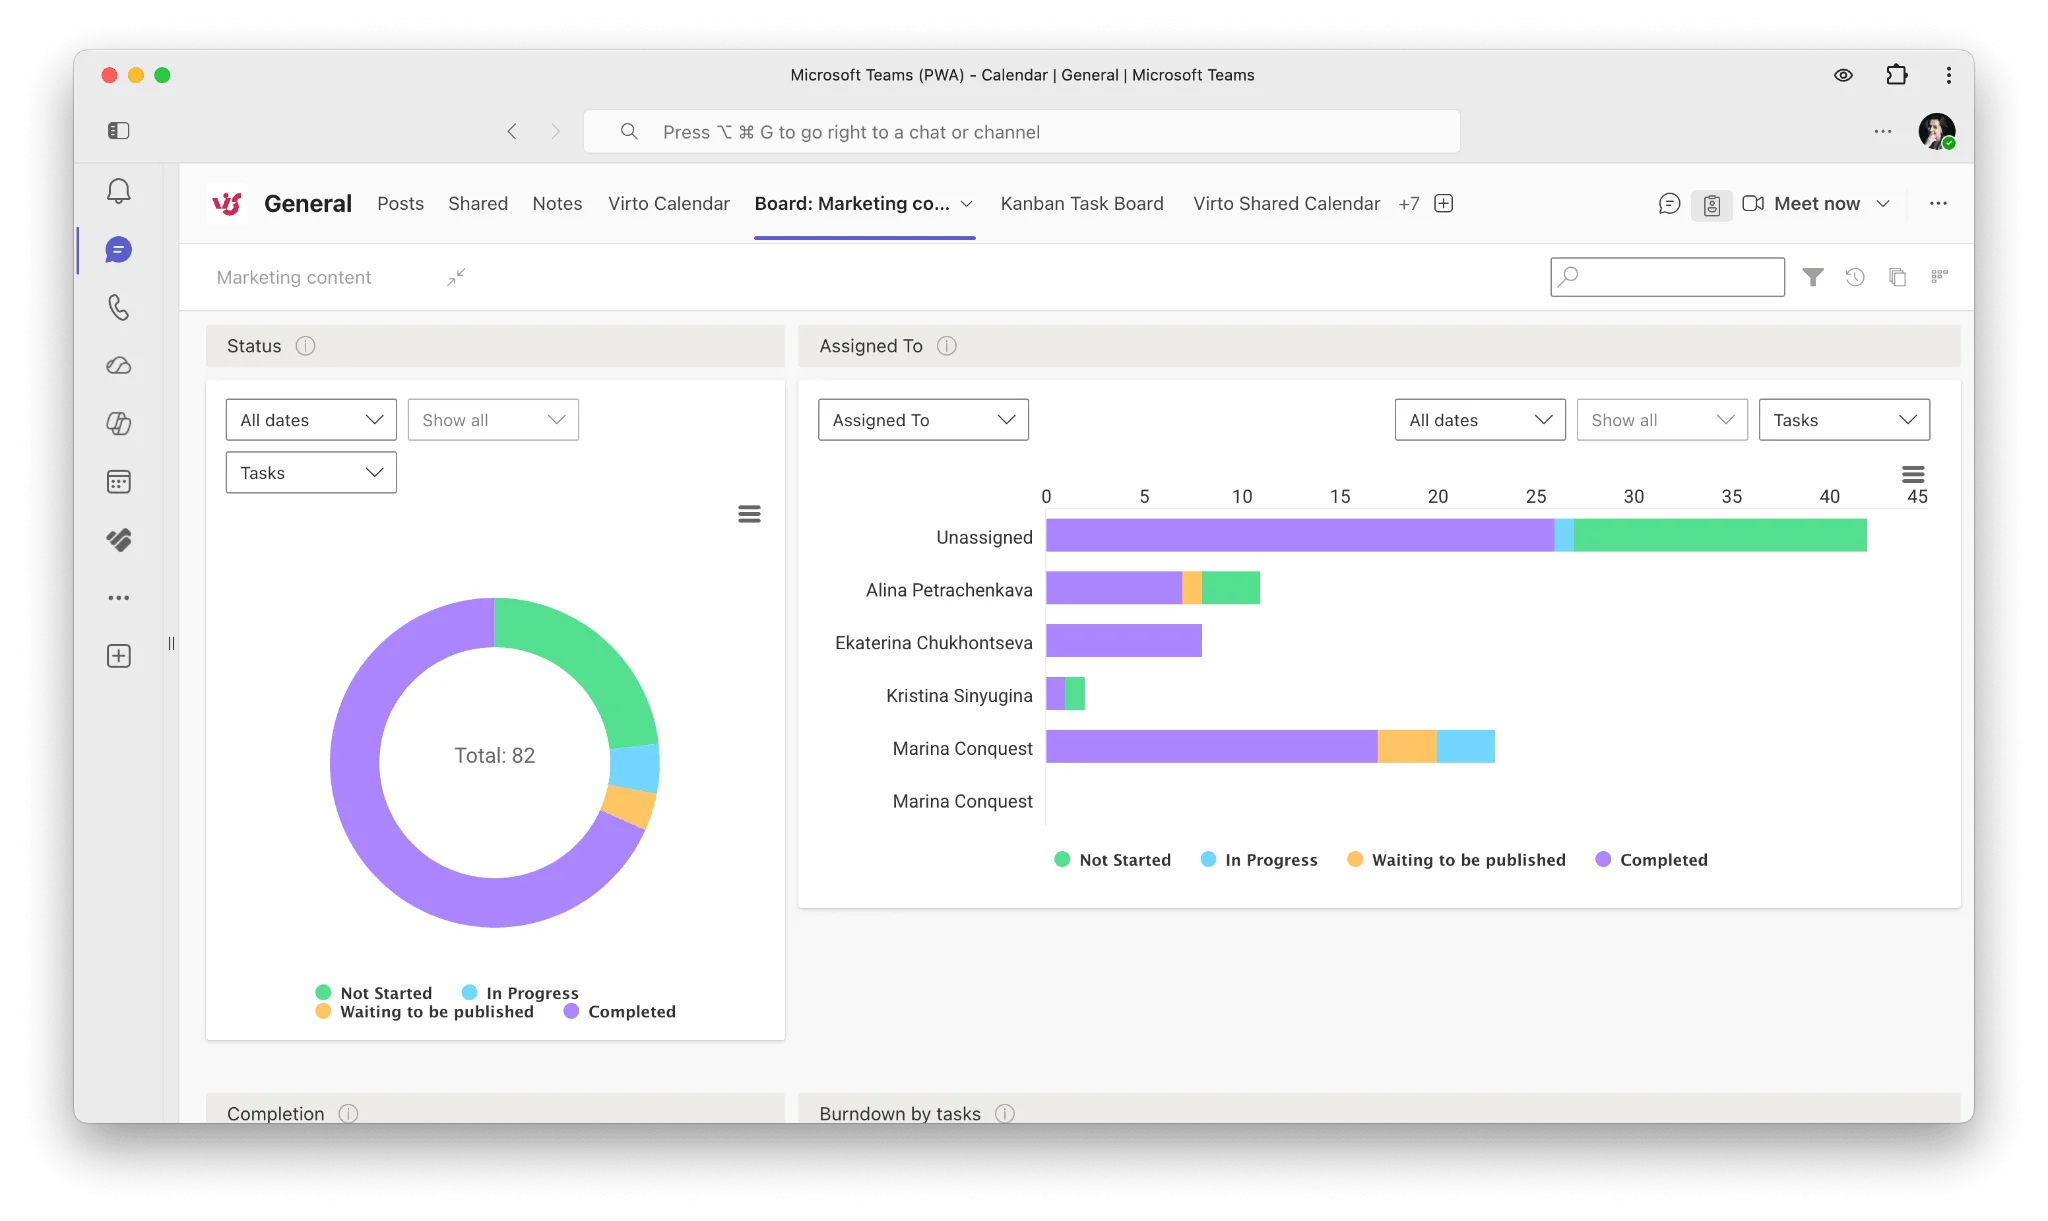
Pic. 6. The SharePoint project dashboard pinned as a tab inside a Microsoft Teams channel.
Dashboard Examples and Templates
You don’t have to build every dashboard from scratch. Microsoft’s SharePoint project management site template ships with a pre-configured project home page you can adapt. From there, common dashboard patterns include:
- Agile / sprint dashboard: a Kanban board grouped by sprint, a burndown chart, and a calendar of ceremonies.
- Status / reporting dashboard: completion and workload charts front and center, with a task list and a document library link.
- Portfolio dashboard: charts summarizing status across several projects, each linking to its own project site.
To create a reusable template, build your ideal dashboard page once, then save the site as a template or copy the page for each new project. Virto Kanban also supports board templates so new projects start from a consistent layout.
FAQ
How do I create a project management dashboard in SharePoint?
Create a project site, store your tasks in a SharePoint list, then build a page that surfaces them using web parts — a task board (Kanban), charts, and a calendar. Native web parts cover the basics; apps like Virto Kanban, the free Virto Charts & Data Visualization App, and Virto Calendar add the board, reporting, and calendar views SharePoint lacks natively.
Does SharePoint have a built-in project dashboard?
Not as a single ready-made feature. SharePoint gives you the ingredients — lists, pages, and web parts like List, Quick Chart, and Highlighted content — that you assemble into a dashboard. For interactive boards and richer analytics such as burndown and workload charts, you’ll typically add apps such as Virto Kanban and the Virto Charts & Data Visualization App.
Can I show the SharePoint dashboard in Microsoft Teams?
Yes. Add the SharePoint dashboard page, or individual Virto board, charts, and calendar views, as a tab in a Teams channel. Because everything reads from the same SharePoint lists, the Teams view and the SharePoint page stay in sync. See our Microsoft Teams project management guide for details.
Is there a free trial for the Virto apps?
Yes. Virto Kanban Board and Virto Calendar each offer a free 30-day trial from Microsoft Marketplace, and the Virto Charts & Data Visualization App is free — so you can build and test a full dashboard before committing. You can start with the Virto Kanban Board app.
Questions on building your dashboard?
Our team is ready to help you set it up.
Conclusion
A SharePoint project management dashboard doesn’t require a separate platform — it’s a project site plus the right web parts, arranged so status, progress, and deadlines all live on one screen. Start with native lists and web parts for the foundation, then add Virto Kanban, the free Virto Charts & Data Visualization App, and Virto Calendar for the board, reporting, and calendar views that make a dashboard genuinely useful. Surface it in Teams, save it as a template, and every new project starts with clear visibility from day one.